
Social Emotional Learning: Supporting students, teachers and science investigations
Teachers learn social emotional learning skills at Teachers of the Estuary (TOTE) in response to school needs.
Bay Backpack provides educators with the tools they need to support Meaningful Watershed Educational Experiences, or MWEEs, for their students. Explore Bay Backpack for teaching resources, action projects, field experiences, and funding opportunities related to the Chesapeake Bay.

Meaningful Watershed Educational Experiences, or MWEEs, are the cornerstone upon which the region’s environmental literacy efforts have been built. MWEEs connect standards-based classroom learning with outdoor field experiences to create a deeper understanding of the environment. Through MWEEs, students of all ages develop a sense of environmental ethics and stewardship that will be essential to the long-term sustainability of our local watersheds and will serve as the foundation of a lifelong relationship with the environment.
Loading video.
Watch directly on youtube.com.Discover a wealth of environment-related books, multimedia, curriculum guides, individual lesson plans and data sources.
Search Resources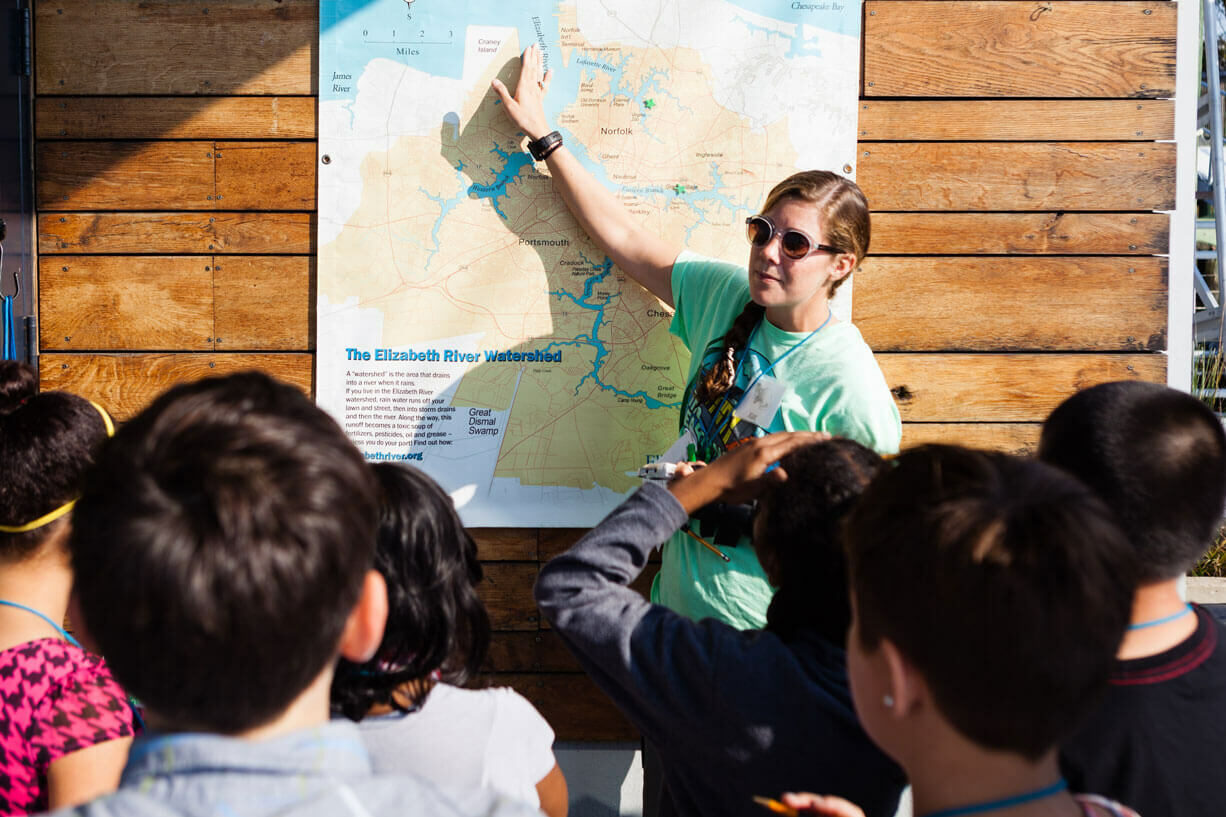
Effectively plan, utilize & sustain a wide variety of school environmental projects.
View Projects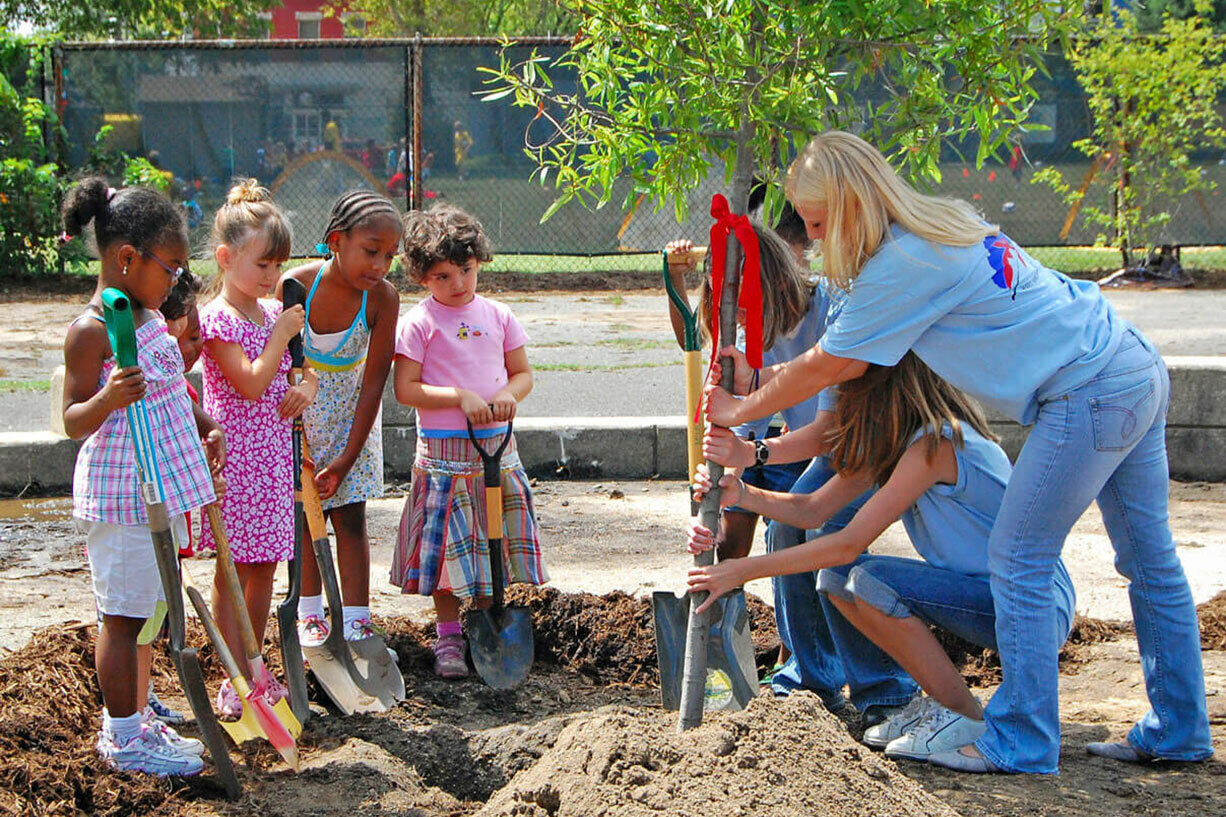
Find a field trip that gets your students' feet wet and hands dirty.
Explore Field Experiences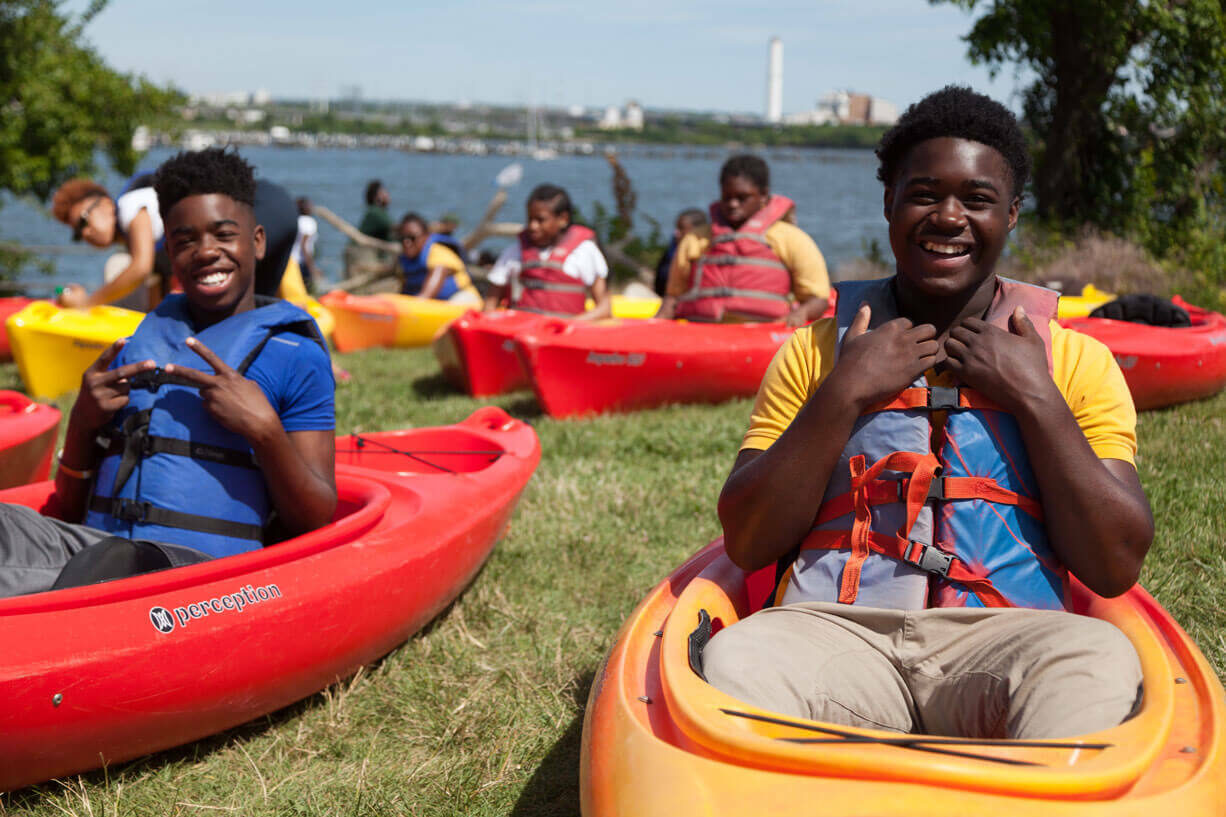
Find grant programs in your state.
Teachers learn social emotional learning skills at Teachers of the Estuary (TOTE) in response to school needs.